GDS
gempa dissemination server
Overview
Disseminate your achievements!
About
GDS is a modular expandable dissemination and publication server. It employs a plugin technology to import earthquake solutions from different sources, filter the incoming earthquake information and disseminate template based messages through various communication channels such as SMS, email, fax, Twitter and various Web services. GDS complements the functionality of SeisComP in the domain of dissemination of notifications and warnings.
GDS at a glance
- Web-based user interface,
- Detailed filter options,
- Bulletin creation based on customizable templates including images with maps, data, diagram, etc.
- Automatic generation of images by GIS (gempa image server) showing maps, waveforms, diagrams, etc. GIS is therefore provided along with GDS.
- Call of external image generating modules by custom scripts, e.g. SIGMA for generating maps with seismic intensities, PGA, PGV, etc.
- Wide range of communication channels such as SMS, email, fax, social media, Web ,
- Plug-in technology to import earthquake solutions from different sources, such as SeisComP,
- Direct connectivity to TOAST for dissemination of Tsunami bulletins,
- Detailed logging facility, including configuration changes, notified subscribers and disseminated bulletins,
- Fine-grained access control, different rolls and privileges,
- Automatic and manual dissemination,
- Modular, expandable,
- Access to event information in real-time and from archive via QuakeLink. QuakeLink is therefore provided along with GDS.
- GDS is perfectly complemented by EQEvents for generating static web sites from event information.
Architecture
up-to-date communication
Architecture
The GDS is built up by a set of individual modules to
- feed
- filter
- automatically and interactively disseminate
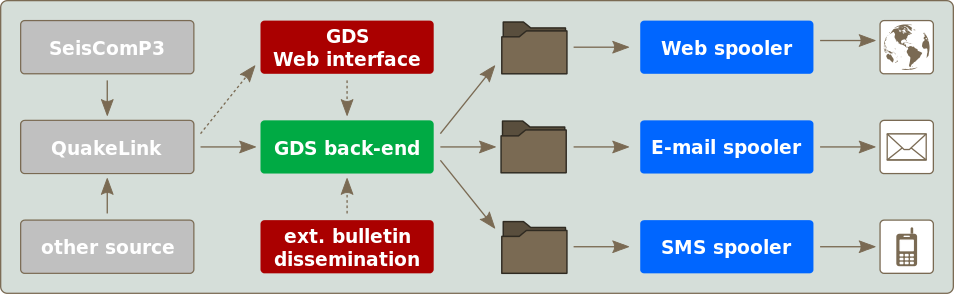
As shown in the architecture, GDS is composed of a bunch of individual modules which acquire (gray), process (green) and disseminate (blue) earthquake information. In addition a web interface (red) exists which allows to configure, interact and review the dissemination process.
We developed a new protocol with a software implementation (QuakeLink) to exchange earthquake information in real-time or based on time windows. QuakeLink offers plugins to import earthquake information from different sources such as a SeisComP system. GDS connects to QuakeLink to receive earthquake updates. Based on predefined criteria new earthquake information is filtered and forwarded to all matching queues. With the help of configurable templates bulletins are created and stored in spool directories. Service specific spoolers (e.g. email, SMS, etc.) send the bulletins to the subscribed recipients.
Web interface
Main perspective
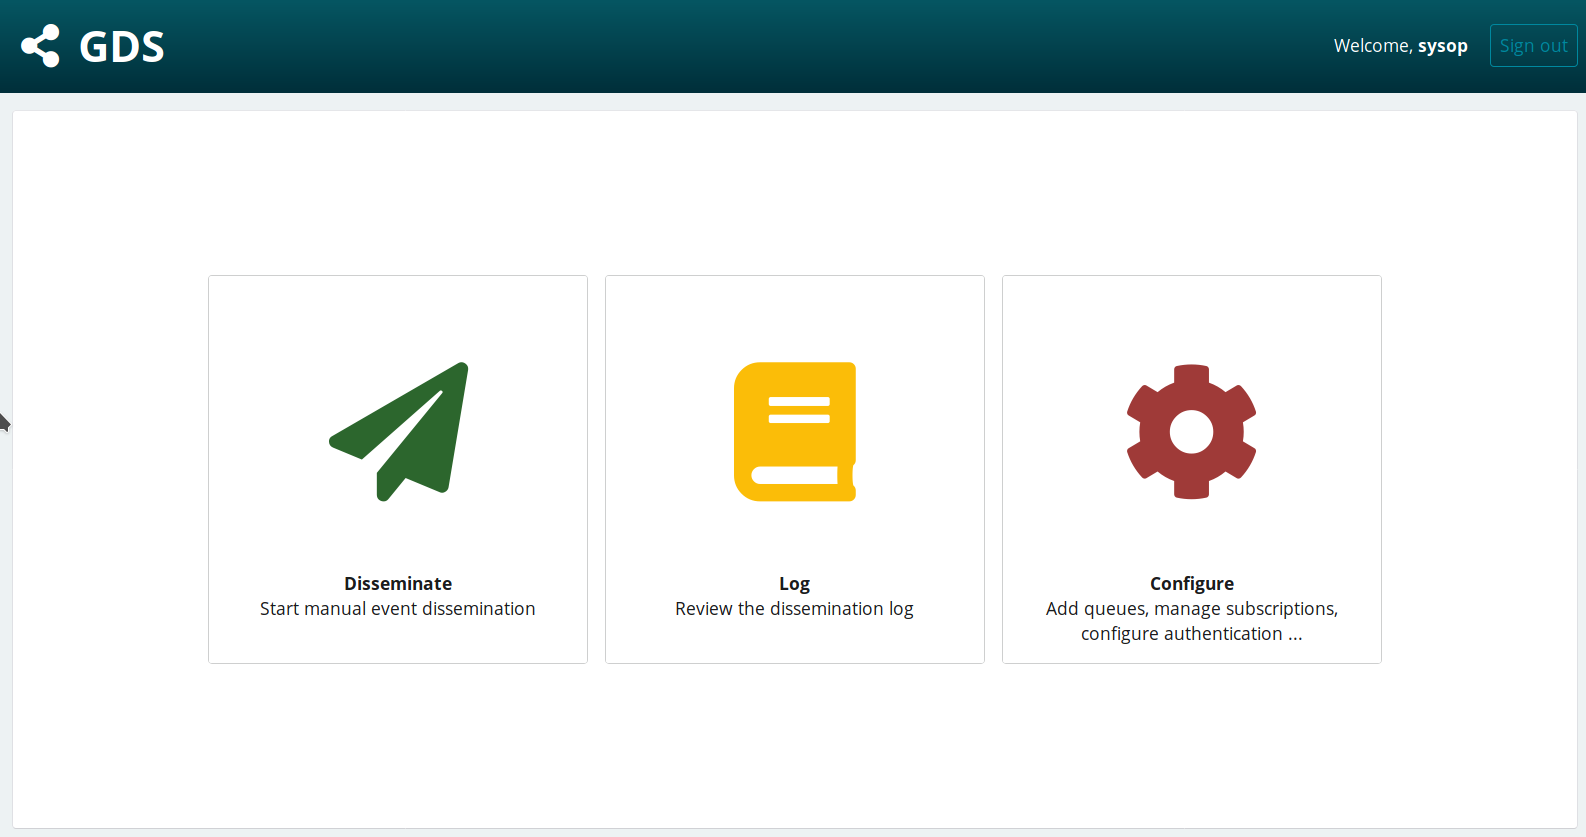
A Web interface is provided which allows configuration of the GDS, interactive dissemination of bulletins and review of the dissemination history.
The Web interface ships with an user management which allows assignment of fine-grained privileges to users or groups of users. For instance the dissemination task can be strictly separated from the configuration part. Modifications to the configuration are tracked per user to be able to track certain changes.
Configuration of dissemination queues, services and subscriptions
Configuration
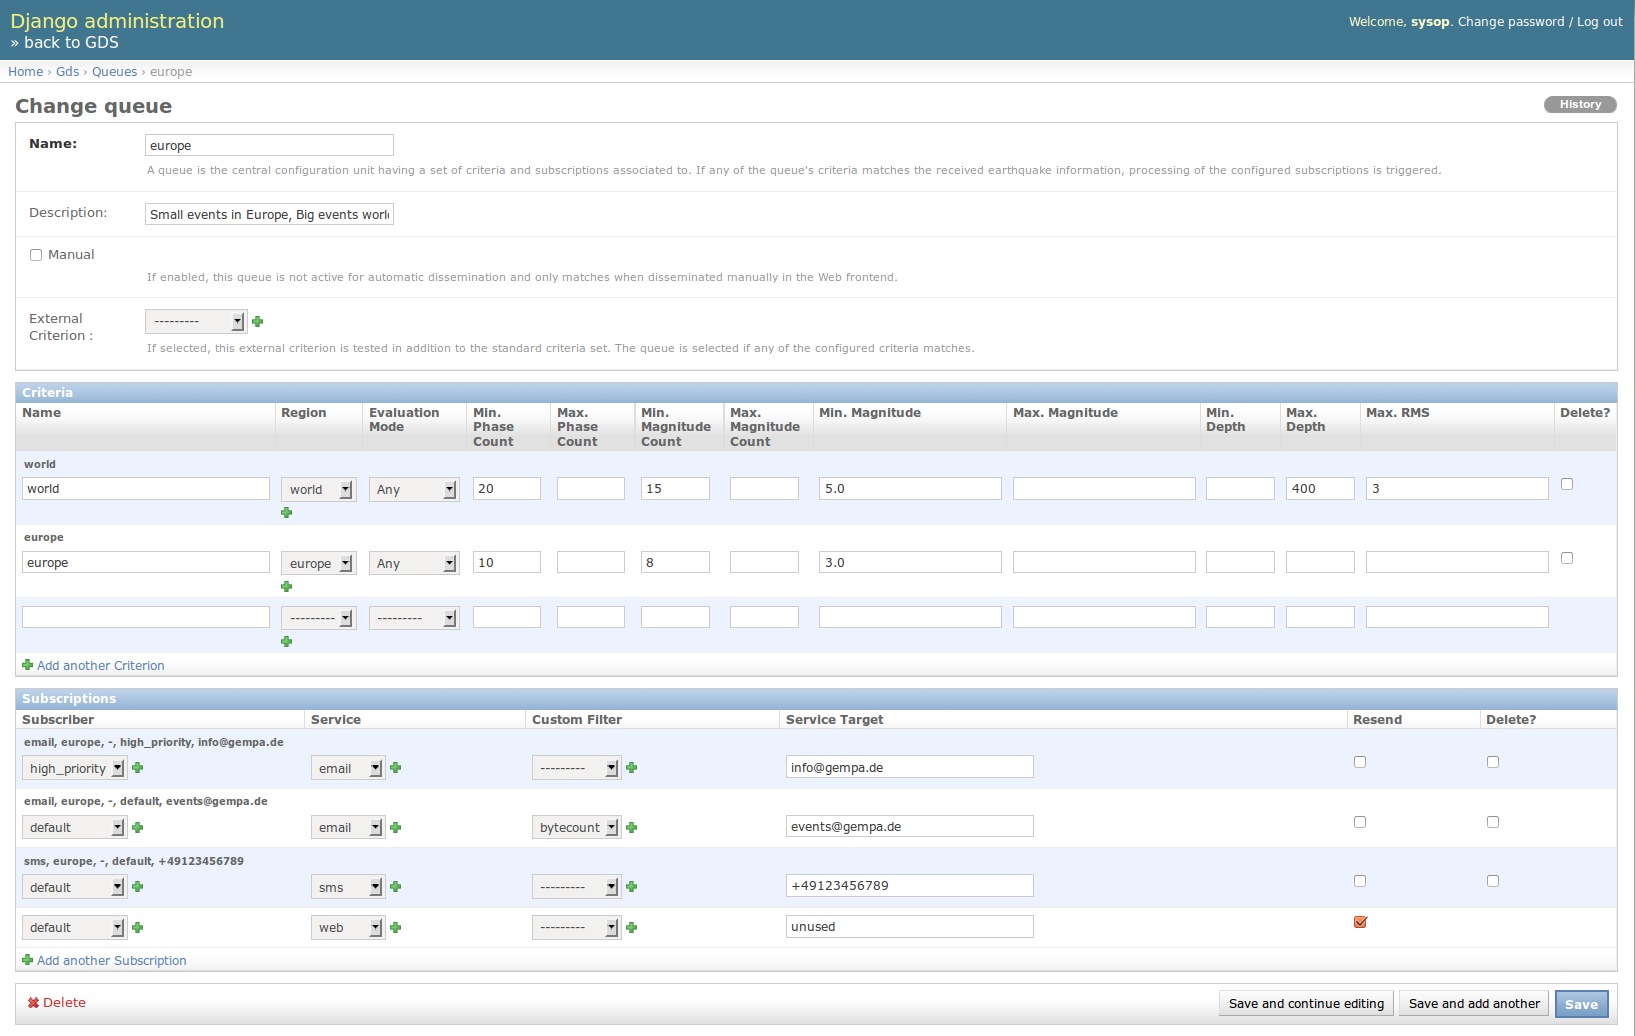
Web-based configuration of dissemination queue, services and subscribers.
The central configuration unit is a queue having a set of criteria (filters) and associated subscriptions. If any of a queue’s criteria matches the received earthquake information then processing of the configured subscriptions is triggered. In addition a queue can be configured to require a manual review before starting the dissemination chain.
A criterion supports the following filter parameters:
- geographic region (latitude/longitude bounding box)
- depth and magnitude thresholds
- evaluation mode (manual/automatic) of the event information
- phase count and quality information
- free key-value pairs (for example intensity, MMI etc.)
If these filter parameters do not suffice external criteria filtering scripts may be configured which operate directly on the event information and report a match or mismatch via their exit code.
A subscription is defined through service, subscriber (user) and recipient information (address). The service defines the bulletin template for formatting the content and the spool directory the content is placed in. If required the default template may be replaced by a subscription-specific template allowing the operator to generate different content for certain subscribers. A subscription can be configured to be triggered only once or for each update (revision) of an earthquake. Typically an SMS is only sent out once, while an earthquake information Web page will be updated with every earthquake revision.
Dissemination
automatic or manual
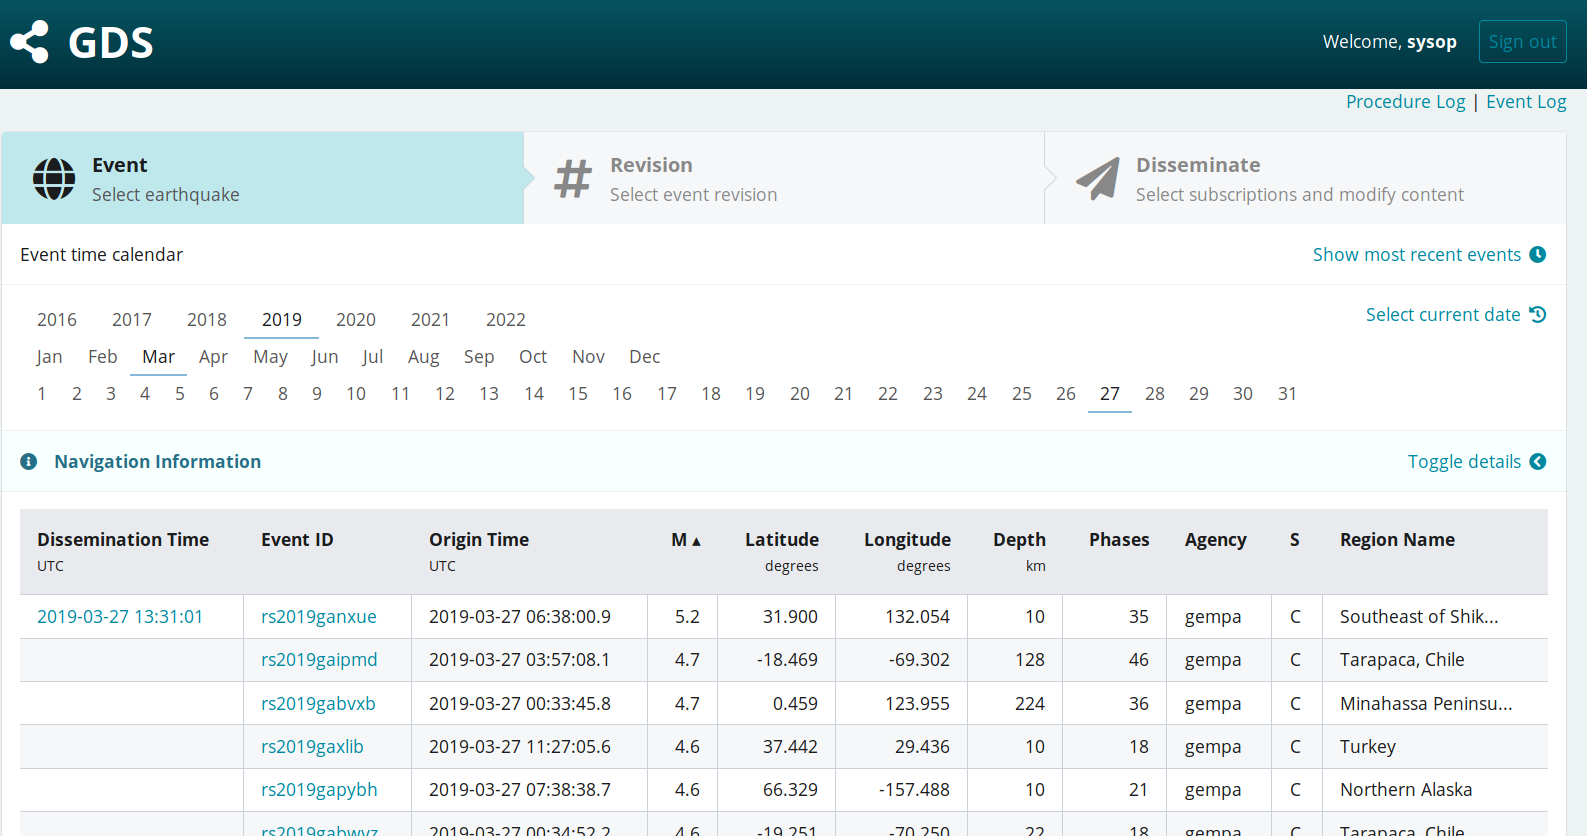
Events can be selected based on a calendar or by choosing form a list of recent events.
The dissemination Web page lists all earthquakes by date and shows the latest dissemination time (if any).
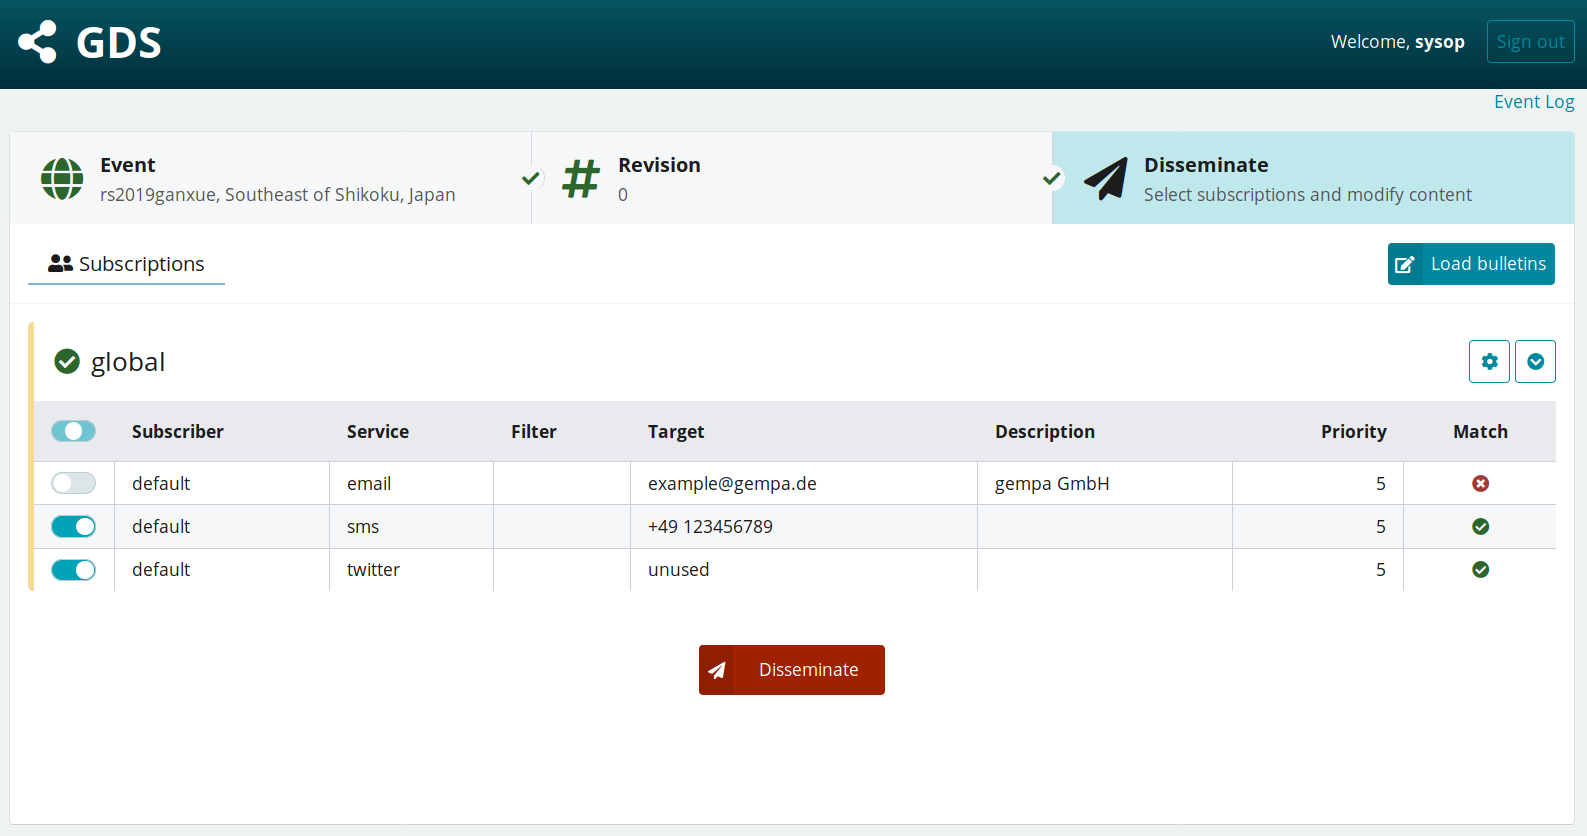
For multiple queues, different dissemination channels and subscribers can be configured and interactively selected.
The Web interface of the GDS also allows interactive dissemination of bulletins. Once an earthquake is selected a list of available revisions including the hypocenter, magnitude and status information is shown. After selecting a revision a list of queues and their subscriptions is shown. By default only subscriptions of matching queues, which also have not received a bulletin yet, are selected. The selection of subscriptions can be changed by the user.
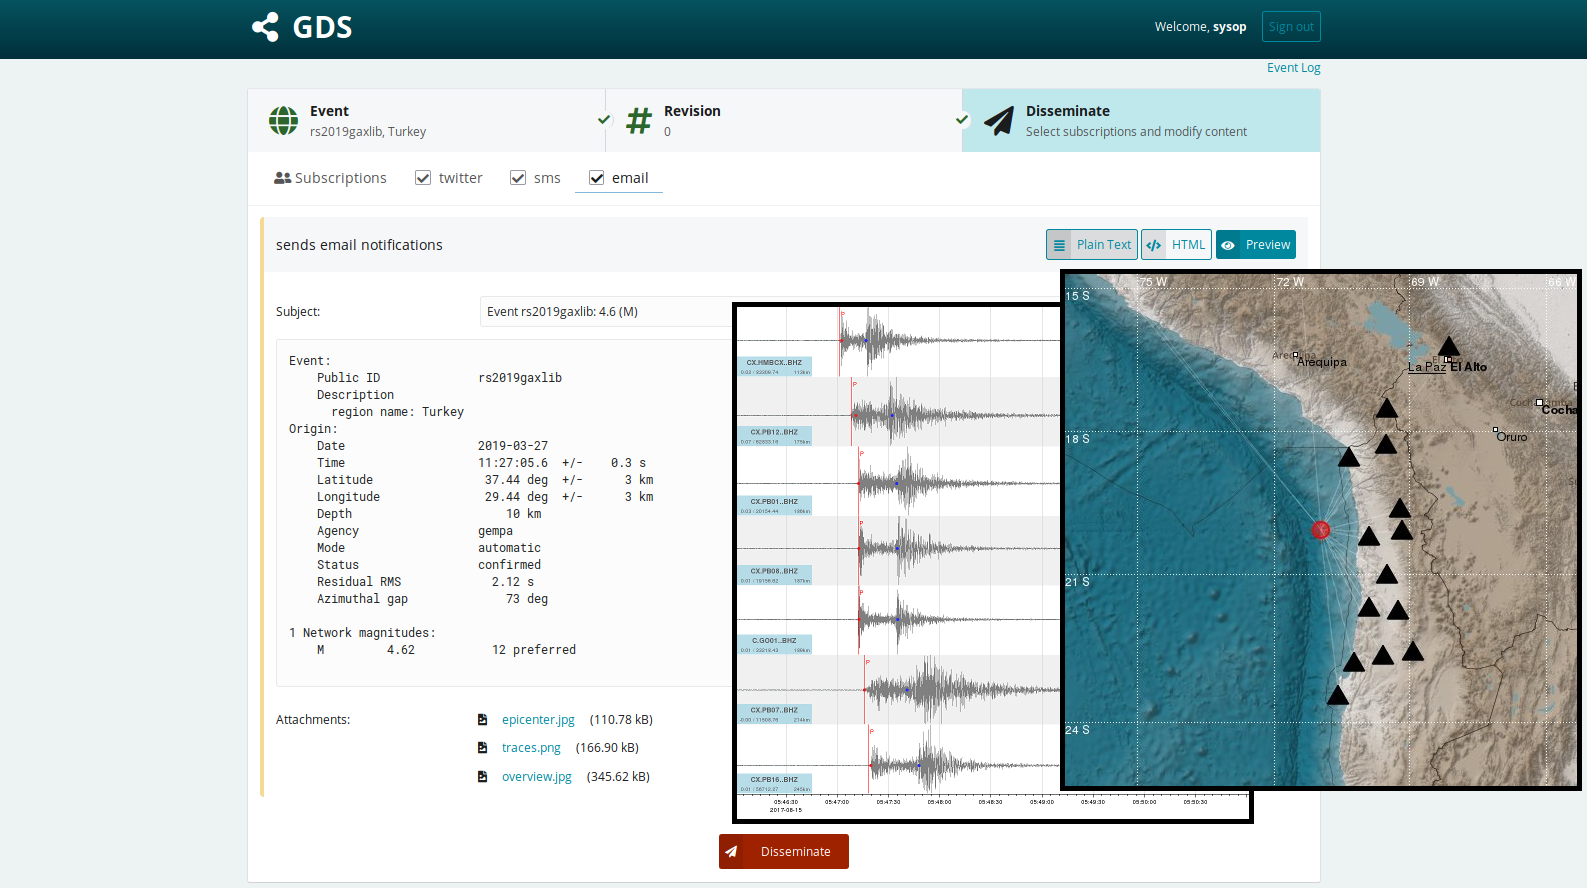
The content can be manually edited and the image showing the event, waveforms and derived parameters can be added.
Prior to dissemination the user may switch to the edit mode to review and optionally alter the bulletin content. This allows operators to add comments to the message text, for example.
Every dissemination step is logged along with the status. The can be reviewed per event and per dissemination.
GDS logs every action which has been done. This includes the configuration and the dissemination. It shows who made the last changes in the configuration and also when an event was disseminated, which services were used and if the dissemination was successful. In addition the content of the message can be checked. All this information can be accessed through the Web interface.
GIS
gempa image server
GIS is our image server providing images of
- Events on maps,
- Stations on maps,
- Waveforms,
- Fourier spectra,
- Composite images of those from above.
Examples are shown above.
GIS comes with a Web interface supporting HTTP-GET and HTTP-POST requests. The interface also provides detailed parameter descriptions and example requests. The GIS package can be purchased separately but is provided along with GDS without extra costs.
EQEvents
static web sites

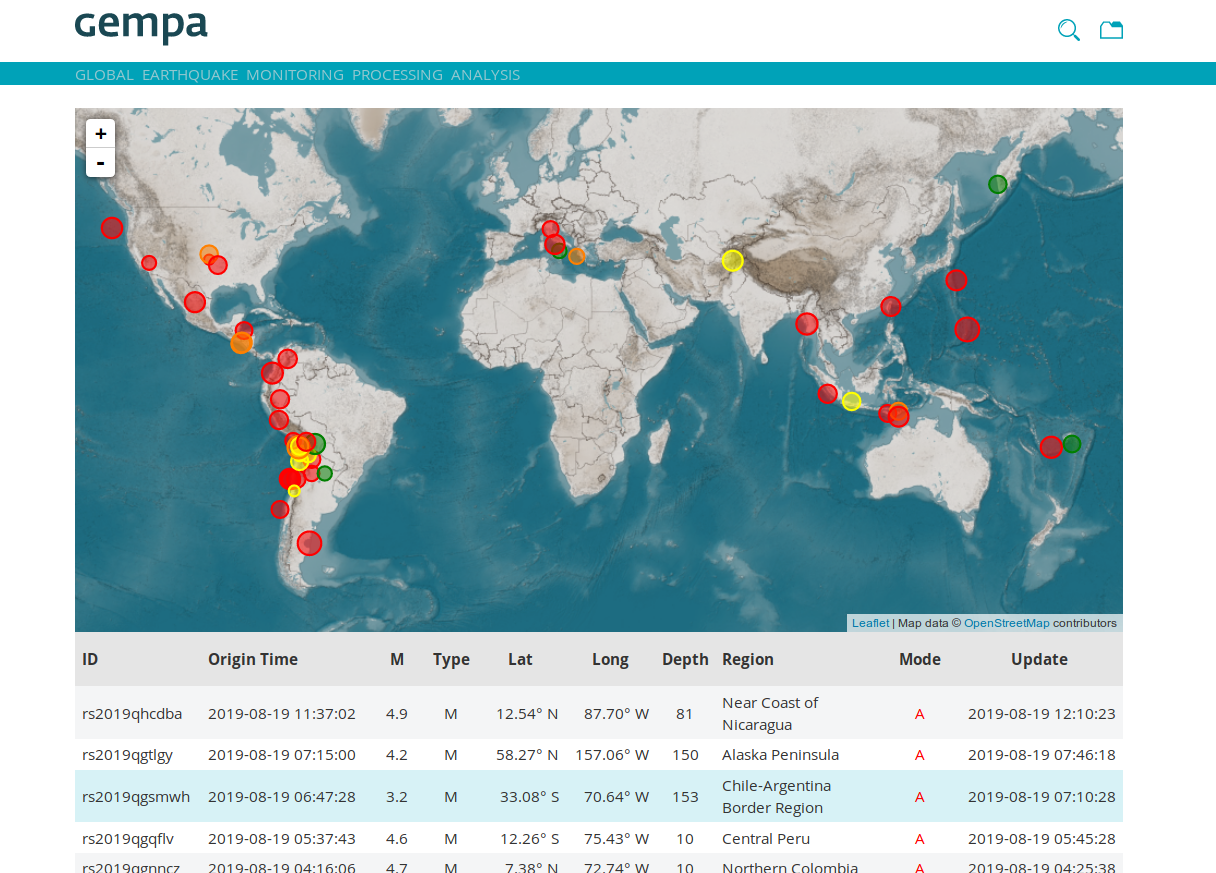
Main page showing interactive event map and table
EQEvents generates a static website of earthquake information from a catalog. An interactive map and table allow to identify earthquakes and other seismic source. Selecting one of them leads to pages showing the provided details. The events can also be searched for in a search mask based on region, time or magnitude or by opening a calendar view. A fair amount of plugins extends EQEvents, e.g., to generate RSS feeds or to export KML files from events which can be opened in other applications such as QGIS or GoogleEarth.
EQEvents is another gempa product which is purchased and set up separately from GDS.
Demonstration Documentation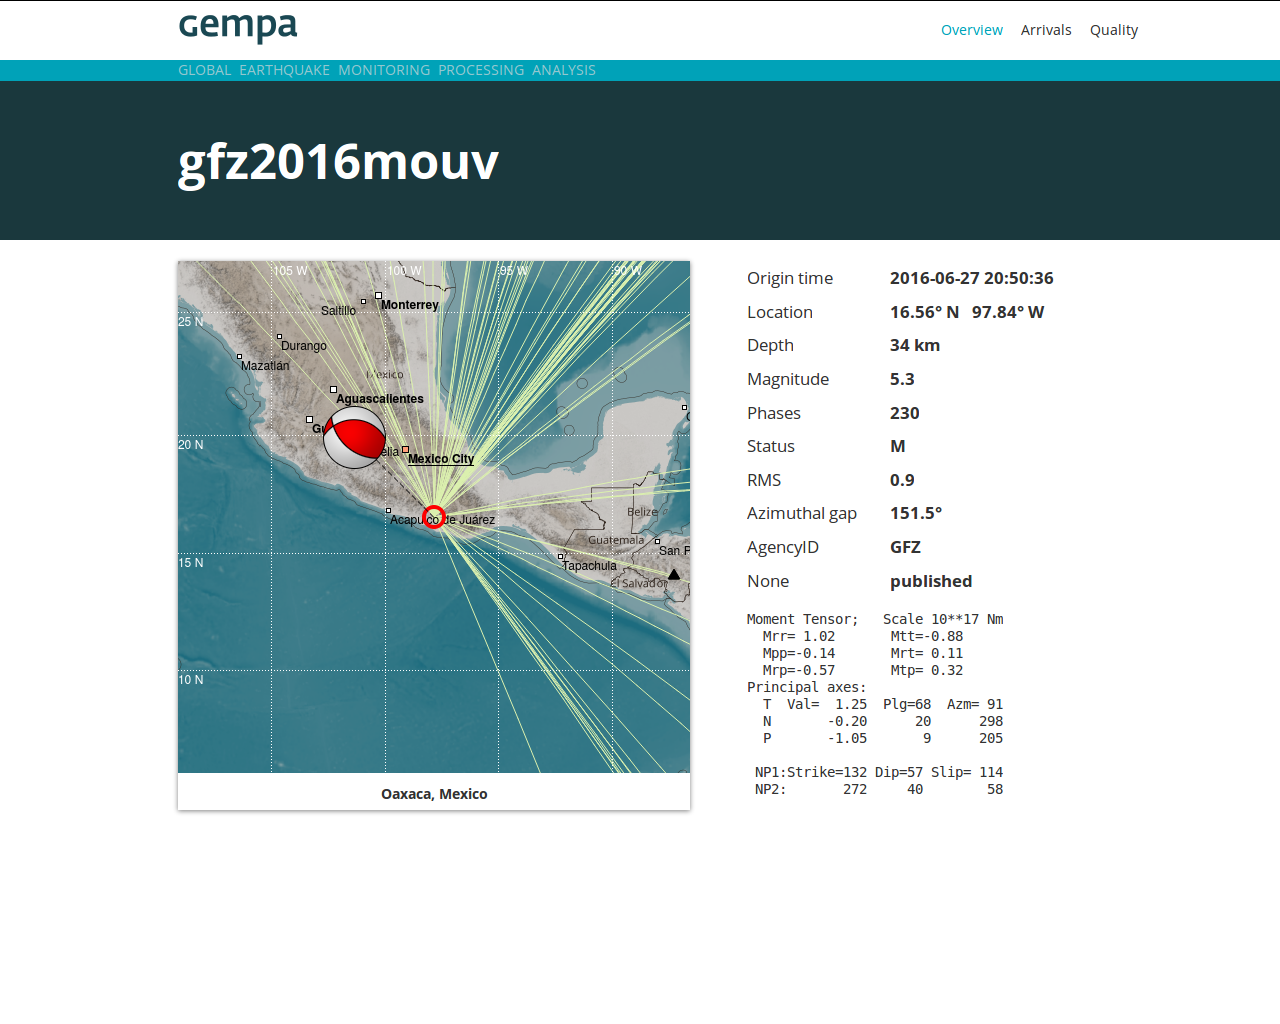
Event overview showing location, source mechanism and many more tailored features.
For any selected event, the available parameters can be displayed on a map and
as text. When combined with GIS, the gempa image server, or SIGMA, our module for calculating shake maps, the displays may include the event
location and station maps, the time, the focal mechanism and even shakemaps or
raw data.
The appearance of EQEvents can be customized to add any layout, logo or color
required most suitable for the application.
Diagrams provide insight into the solution quality.
The quality of earthquake solutions is indicated by diagrams showing the arrival times of any automatically or manually detected phase. Residual plots show the goodness of individual phase picks.