GAPS / WebApps
Web based earthquake analysis
Overview
What is GAPS?
GAPS is our application server integrated into the SeisComP framework. It exposes interfaces accessible through the HTTP or the WebSocket protocol closing the gap between desktop and web-based access to SeisComP. It provides:
GAPS is optimized for high load, serves static files like css, html, js and exposes an Ajax API to receive SeisComP objects likes picks, quality parameters as well as data records in real time. GAPS complements QuakeLink to build interactive and responsive Web applications for SeisComP.
GAPS ships with highly interactive modern web applications to monitor seismic activities and to show real time data of your network or monitor station qualities. Event information is accessed in real-time and from archive via QuakeLink. QuakeLink is therefore provided along with GAPS.
EQView
Monitor seismic activity
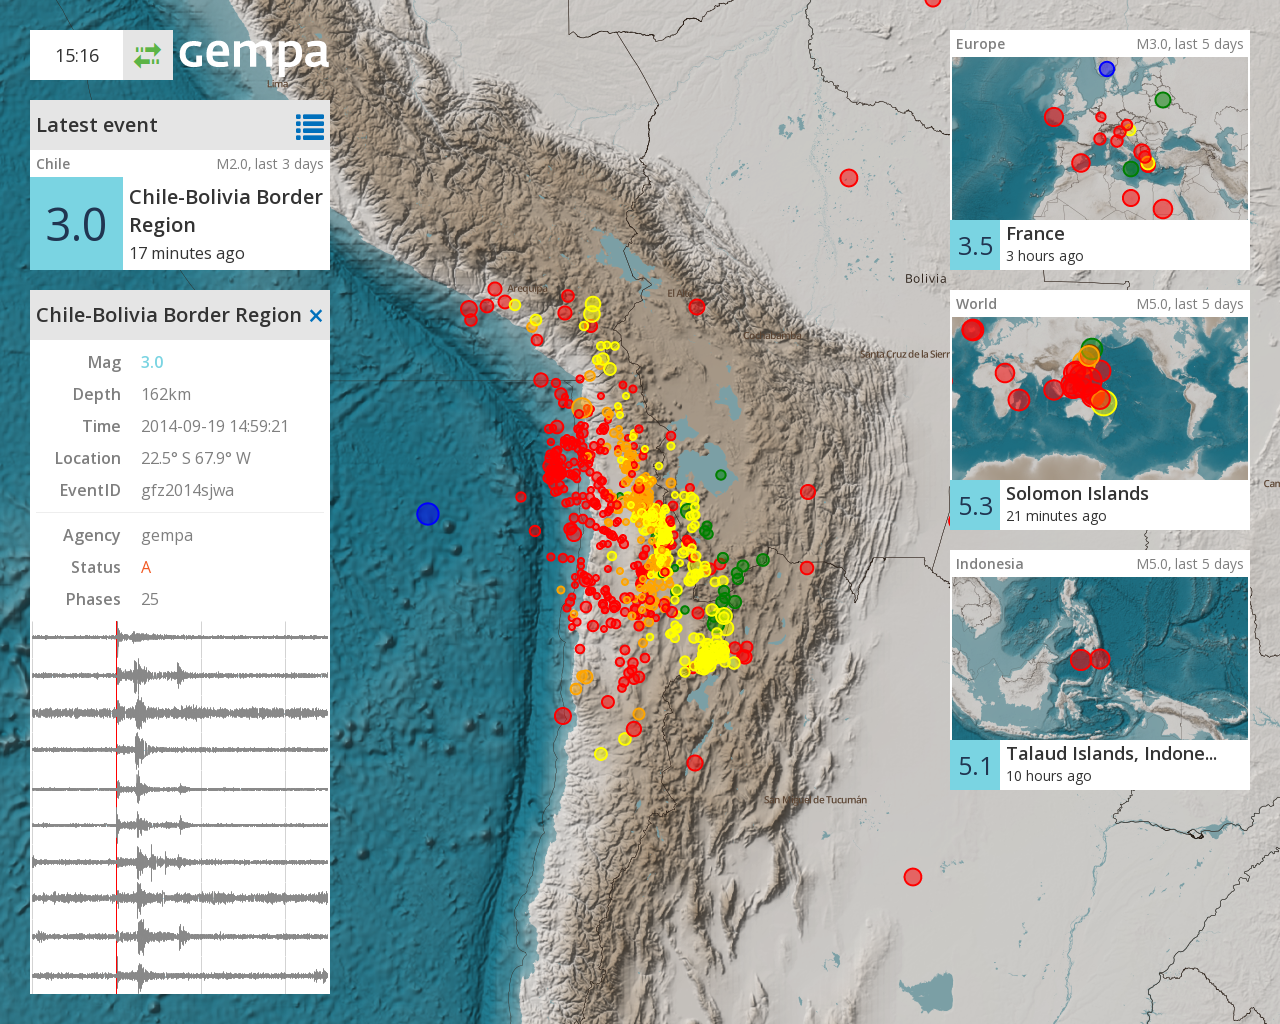
EQView showing recent seismic activity
EQView shows the recent seismic activity, most likely earthquakes, in predefined regions: widgets. Each widget shows one region with custom event filters, e.g. all events not older than one week with magnitude above 5. The region widgets are shown in the upper right corner.
When a new event has been detected, a panel will open (see screenshot: lower left corner) showing the traces of the next 10 stations along with more detailed information. After a configured time span that panel will close itself again. Furthermore the most recent event is blinking in the main panel as well as in the widgets.
StationView
Monitor station quality
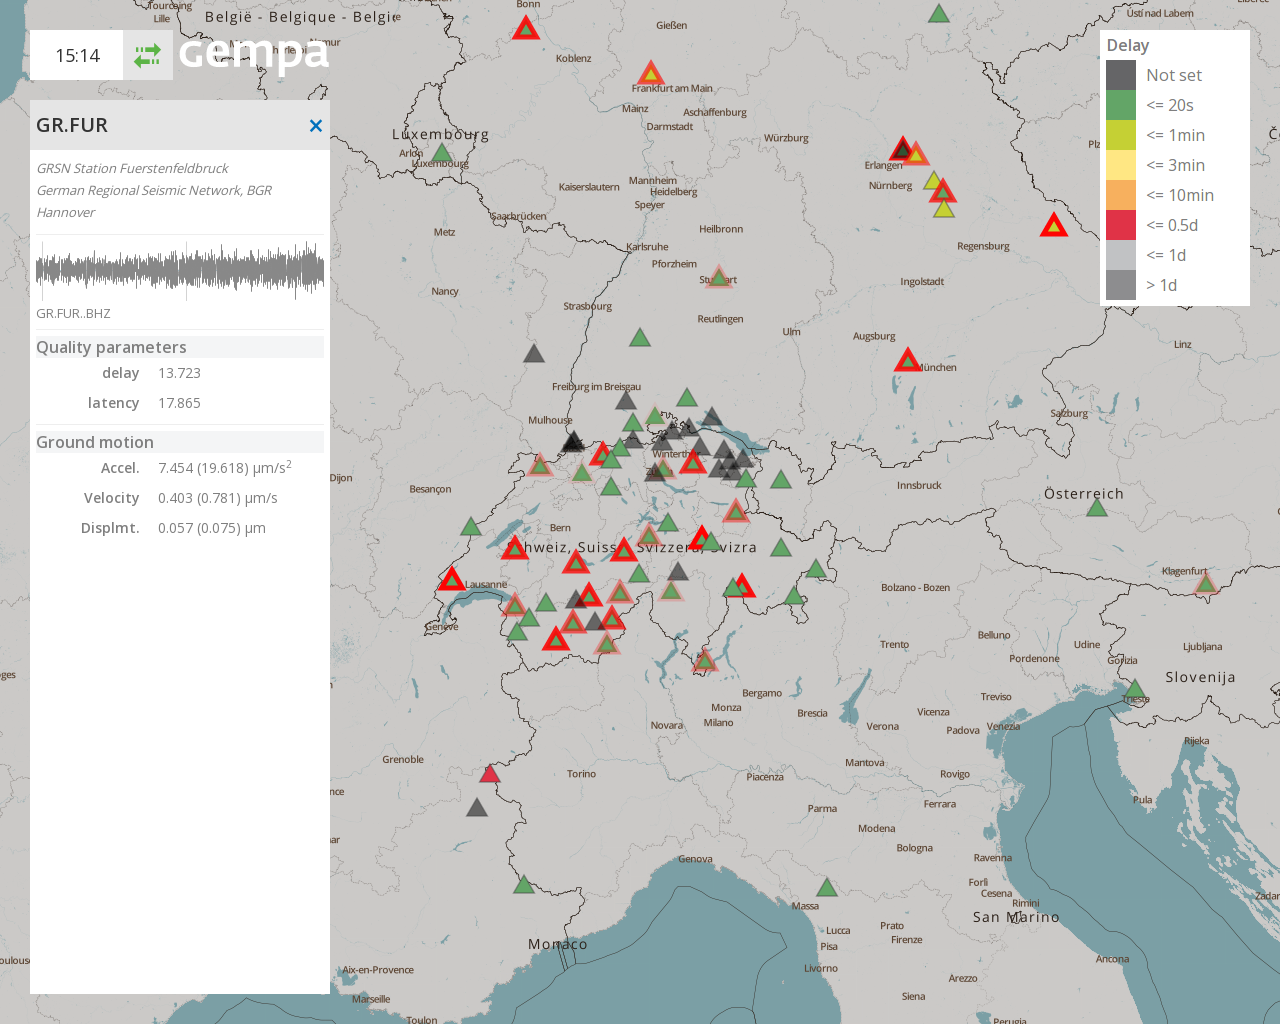
StationView showing station quality
StationView shows a map with all configured stations of your SeisComP installation. The color encodes the currently activated parameter:
- Delay
- Latency
- Ground motion
The red border of the station symbol indicates that a pick (a detection) has been made. The more opaque the border the more recent it is. Clicking on a station opens the panel (see screenshot: left side) showing the last 10 minutes of real time data along with more detailed information.
TraceView
Data and event analysis
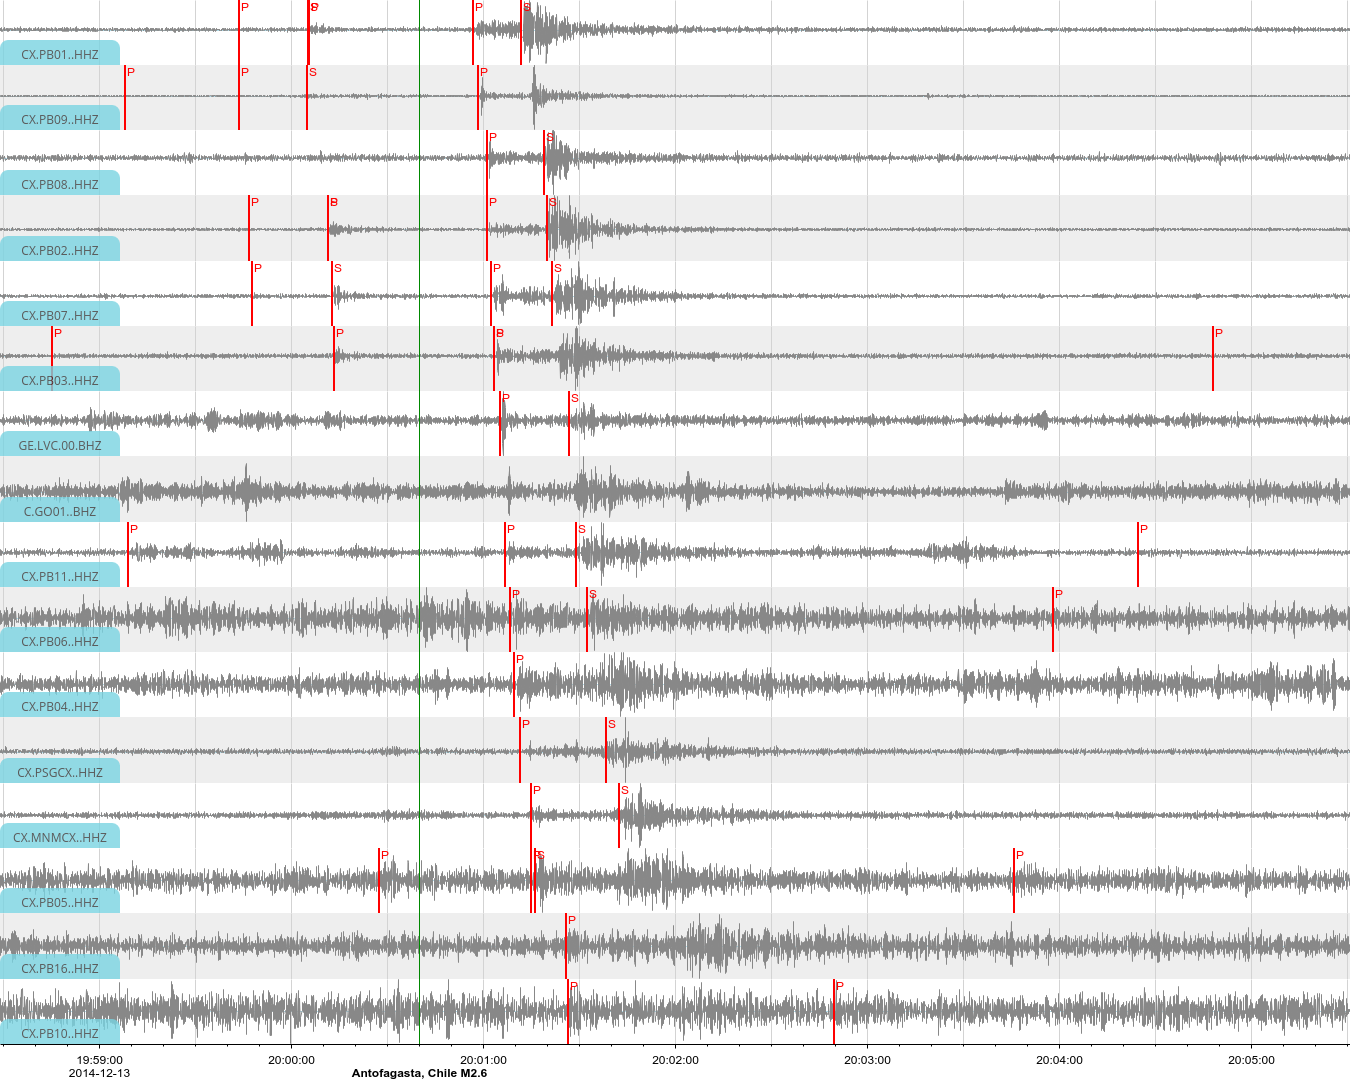
TraceView visualizing real time data streams
TraceView visualizes your real time data streams just like scrttv. In addition it shows the latest event indicated by a green line with magnitude and region and all P and S phase detections.
